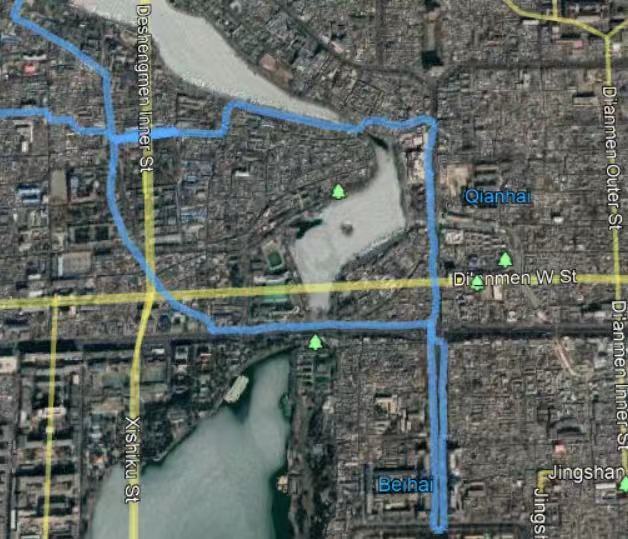
https://groups.google.com/forum/#!msg/cartodb/PHKbPWKvMmc/NKe18KSt-pUJ
Hi Amanda,
Are you doing the tutorial but with your own data? Did you get the tutorial to work just on its own first? It might help to run through it as is first so you can get a hang of what it does.
To do it with the table map_1, I would just run this query,
SELECT 0 as cartodb_id, ST_MakeLine(the_geom_webmercator) the_geom_webmercator FROM map_1
UNION ALL
SELECT cartodb_id, the_geom_webmercator FROM map_1
The first half (before the UNION) makes a line from all your points. The second (after the UNION), just selects the points as is.
Next, on your map you are probably only going to see points. That is because there is no style set for drawing a line. So I would use the following CSS,
#map_1 {
//points
[mapnik-geometry-type=point] {
marker-fill: #FF6600;
marker-opacity: 1;
marker-width: 12;
marker-line-color: white;
marker-line-width: 3;
marker-line-opacity: 0.9;
marker-placement: point;
marker-type: ellipse;marker-allow-overlap: true;
}
//lines
[mapnik-geometry-type=linestring] {
line-color: #FF6600;
line-width: 2;
line-opacity: 0.7;
}
}
hope that helps!
Andrew


